Output overview
All output can be found on Google Cloud Storage where files are created using a snakemake pipeline which was ran locally.
Data trelliscopes
As an exploratory step we can browse the data using this trelliscope,
– NOTE: Errors when rendering this external .html file(!) Any tips about how to include external .html files like this are welcome. –
For now, download the trelliscope as a .zip file from Google Storage bucket: https://storage.googleapis.com/lvt-schiphol-assignment-snakemake/trelliscopes.zip
Unzip the folder and open the index.html file to view the trelliscope.

Project summary
Project goal
Predictive modeling of delays of departing aircraft at Schiphol. We are provided with 2 raw data files of flights and airports.
This project assignment is used to,
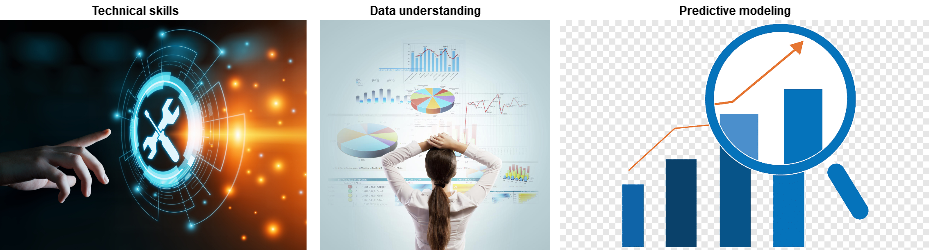
- Display technical skills
- Understanding and flexibility when handling new datasets
- Make a prediction model of flight delays
While the assignment description specifically calls for a prediction model and data understanding, I have focussed mostly on 1.: Display technical skills..
I have taken the liberty to deviate quite a bit from the assignment and understand that especially requirement 2. Understanding new dataset is largely skipped in my results. Allow me to motivate why I have made this decision from the assignment.
Motivation for not sticking to assignment requirements
Because this assignment is a code assessment rather than a true business case I have taken the liberty of deviating from the requirements. My focus was to prove my technical skills more so than my data exploration or modelling skills. I believe that with my current results I can show my technical strengths in a way that differentiates my approach from others.
Because of time constraints I had to choose between,
- Spend time focussing on data understanding and creating a good prediction model
- Spend time focussing on what I believe is important project setup
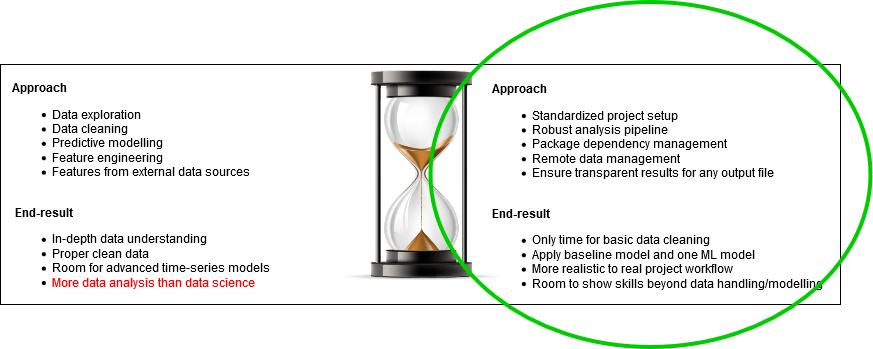
I have chosen to spend most time on 2.. Because I have not developed a deep data understanding I also do not have a great model performance. However, I do have a project setup in which adding a new better model is a breeze which would make this project much more robust in the future when moving to production.
Unoriginal results from previous internal results
In this assignment I felt I had a conflict of interest because my team internally already did quite some exploratory analysis of the flights data and the Schiphol API’s before this assignment. We have weekly demo’s so I am kind of familiar with the datasets and questions they already asked, though I did not write the code for them at the time. Then I noticed I was writing code to reproduce the answers to questions they had already answered, which I don’t think would highlight my technical skill.
The first steps I took were to look for their notebooks for data understanding and API descriptions, then I realized that any exploratory analyses, external datasets or models would not be my ideas. So I only did basic exploration and modeling, and instead treated this assignment as the start of a new project within a team of data scientists.
The first steps I would take for a new project is to apply structure in a way that allows for continuous data science, where we present results to the business as soon as possible even when the results are still in an early phase and development is required to achieve good models.
A handful of strange things found in the data,
- Exceptional number of samples on some 1st day of the months
- Two timezones in the data at Schiphol we may have to deal with
Go beyond data analysis
The question I was asked to answer was to create a prediction model. As a data analysis project I could deep-dive into the data and make a single-use analysis and show that I could make predictions on the dataset I was given, possibly collect data from Schiphol API’s to enrich the feature set and improve the results. Traditionally I would do exactly that, with a lot of inspiration from existing examples on Kaggle and blogs.
From experience I have noticed how important good project setup can be. An efficient workflow takes time to setup but will benefit a single data scientist, a team of us and especially the business. To display my coding skills I chose to setup a data analysis pipeline with,
- Package dependency management
- R and Python code use
- Reproducible Snakemake pipeline
- Cover all standard steps in modelling pipeline
From here I can show how easy it is to now add additional models, features from external data, analysis results, any steps you can write in a notebook.
My differentiating strength
Having worked together with data scientists in multiple teams both internally and as a consultant I have noticed that you’ll find team members who are strong at modelling, visualization, dashboarding, building API’s or even efficiently using unit-tests. What I was missing was motivated knowledge of project management where,
- analysis results are reproducible
- data is reusable across different steps in the analysis pipeline
- models are saved from where they can be deployed
I have since taken an interest in ensuring reproducibility, traceability of results and an efficient development setup. By efficient development setup I mean that other contributing data scientists can painlessly add their ideas to the project. Now, any new idea can be implemented in a dedicated notebook that is easy to integrate in a larger pipeline. Each notebook under /scripts represents an analysis step, relying on previously created data if possible but not necessarily.
Approach
Predicting aircraft delays at an airport is a core problem for the airport that may affect flights scheduling, managing flow of people, departure gate assignments, etc. Because it is a complex problem to predict airplane delays effectively I have created a project workflow in which a data scientist or a team of data scientists can develop quite painlessly. Traditionally I would approach an analysis assignment like this with a handful of notebooks that explore the data in-depth, then use that knowledge to preprocess the specific dataset I was handed and then create a model to prove how good I can make predictions. together and contribute models to an analysis pipeline.
The idea is that when you reach this stage quickly, it becomes easy to communicate new results to the business in a way that they can contribute ideas because your results are easily viewable. Combined with the fact that each analysis step is a concise rendered notebook with results that are understandable by both business and development interest.
With the current project setup I have built it has become easy to add new models and analysis steps to the pipeline while reusing earlier results, such as calculated features or train/test set splitting. All used notebooks are self-documenting and included on Git, and rendered on readthedocs.
What I focused on
File directory setup
Have a look at the README on GitHub for a more detailed file directory setup.
Steps taken,
- Use cookiecutter from drivendata, https://drivendata.github.io/cookiecutter-data-science/
- Scripts in the project are notebooks that can be executed with papermill
- Note how papermill notebooks are similar to parameterized notebooks on DataBricks.
- Data is on Google Cloud Storage, with public read-access annd private write-access.
- Use
Snakemaketo structure output files, easily use local, remote bucket or even Azure DataLake - Sphinx documentation from files under
/srcand rendered example notebooks from/scripts
Remote data source
I used Google Cloud Storage on a personal account and created a storage bucket. All project data including analysis results, rendered notebooks, models, etc. is all in the bucket!
Browse the data here: https://console.cloud.google.com/storage/browser/lvt-schiphol-assignment-snakemake/
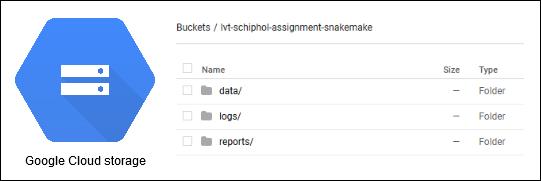
You may need to login to GCP, but you do not need specific project access.
Steps taken,
- Create storage bucket in new GCP project
- Set public read-access and create service-account for write-access
- Define
Snakemakepipeline to manage all output data files and structure- Manual data changes causes the pipeline to re-run analysis steps because files go out-of-sync
- All data on the bucket expected to be created from pipeline, similar to managed datasets on DataLake
Reproducible analysis pipeline
For this I use Snakemake! Since my job at TNO I have kept an eye on Snakemake, which is sadly still not working smoothly on Windows. It is simply a Python package for which I think the syntax is easy to read and the output results are sufficient for a project like this.
As per snakemake,
The Snakemake workflow management system is a tool to create reproducible and scalable data analyses. Workflows are described via a human readable, Python based language. They can be seamlessly scaled to server, cluster, grid and cloud environments, without the need to modify the workflow definition. Finally, Snakemake workflows can entail a description of required software, which will be automatically deployed to any execution environment.
Steps taken,
- (!) Fork Snakemake and fix recent bug on Windows, https://github.com/Lodewic/snakemake
- Even in the Docker container we’ll install my own version of the package
- Create Snakefile with pipeline definition
- Add config.yml with relevant settings
- Authenticate with Google Cloud storage to sync pipeline output
- Create rules for each script under
/scripts - Create multiple conda environment.yml files for different types of scripts
Additionally you can find more output here,
The Snakemake pipeline currently looks as follows,

Sphinx documentation
You can find the full documentation here, https://schiphol-assignment.readthedocs.io/en/latest/
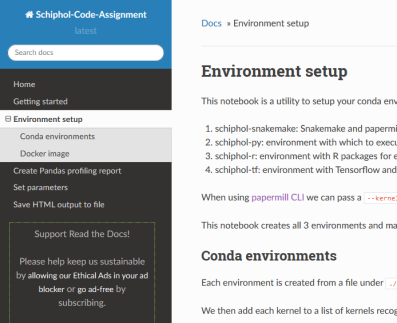
Note that I have played with Sphinx earlier, but never to a stage of published pages. This will document the project progress, links to relevant files and most importantly code documentation.
Steps taken,
- Setup Sphinx project under
/docs - Set content and config of documentation pages, including rendered notebooks
- Setup build pipeline from GitHub on readthedocs.io
- Publish pages whenever master branch changes
You’ll find that the /docs directory is fully functional and will allow you to create a basic documentation page. Cool thing is that notebooks are also included in the documentation pages, which then easily integrates our notebooks we use as scripts under /scripts. These script notebooks all expect a certain format, namely a description of the notebook, the input parameters and the expected output files.
Sphinx docs will include both the python modules under /src and the applied notebooks under /scripts.
What I left out
Due to time constraints I have not focussed on the data as much for the assignment, as stated earlier. So what you may be missing is,
- In-depth data analysis
- Pretty plots
- Display of object-oriented programming
- Connecting to external datasets
- Complex time-series models
Exploration summary
As noted this part is very basic.
A great tool for a quick display of the data as first step when receiving the data.
Creating these profiling reports is an easy first step, and the notebooks that create them are a good first example of using notebooks as papermill scripts.
Output HTML files are saved to our remote bucket and is publicly available,
First thing we made was a profiling report of the data for quick results. Luckily the data is already fairly clean from the start.
Airports data profiling report HTML Flights data profiling report HTML
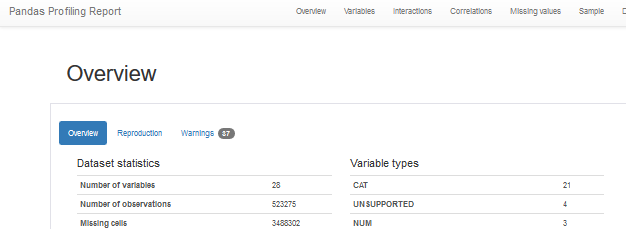
This summary of the flights data already teaches us a few basic things,
- Missing values of
actualOffBlockTimewhere we cannot calculate the delay - Duplicated ID values in the raw data!
- 97.2% of all flights is
serviceType==J , passenger flights - Some columns contain no data at all
- And more:)
There are columns which we should not use for delay prediction which I believe to only be known After the delay is known or a flight is even canceled.
- expectedTimeBoarding, expectedTimeGateClosing, expectedTimeGateOpen
- No idea when these values are determined, but unlikely that these values are known/equal 2-hours before the scheduled flight
- Therefore these columns not considered for prediction now
We will consider these findings downstream when we process the data for model input. Scripts to perform preprocessing are documented themselves so for the implementation of handling the data please look at the scripts.
More points to take with us from here,
- ID’s are unique despite duplicates in the flights data
- By far the most flights are of
serviceTypeJ for Passengers - A lot of airlines only have a handful of flights
- A lot of destinations only have a handful of flights
- Clearly categorical data with many small levels is an issue that needs to be dealt with
- Delays are anywhere from 1-hour too early to over 10 hours, with a very skewed distribution
- Requires work to find fitting error metric for model evaluation
- Creating time-series data without data leakage will be a challenge!
- For every flight, we know after the fact what the delay was. Be careful not to take the actual delay when at the time of prediction a plane is simply ‘still delayed’ but it may be unkown for how long.
The model scripts are self-documenting and examples can be found on readthedocs, rendered on Google Cloud storage under {bucket}/data/model_output/{model_name}/{model_script}.ipynb.
- Baseline average model
- Basic catboost model
- TODO: chained catboost model - or any other model
- Predict quantile of delay
- Separate within-quantile models trained and normalized within range of given quantile
- New prediction first predicts the quantile - then makes a regression output based on that quantile’s model
[ ]: